


Centralize All Your Log Data In a Standardized Format
Event and Log Management Features
 Event Collector
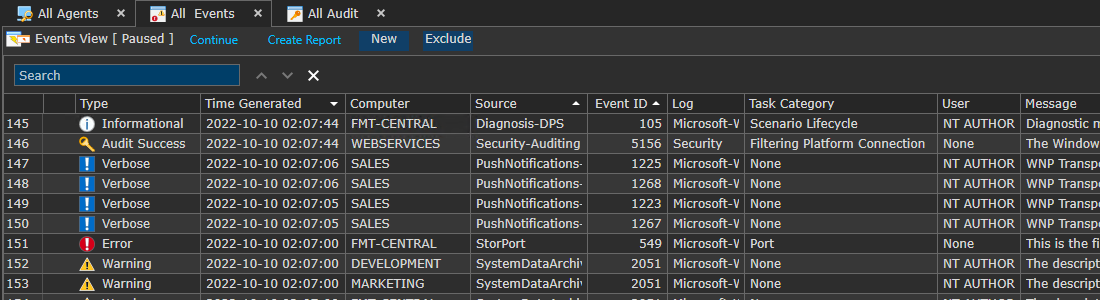
Real-time event collection from any Windows event log with full message details.
The Event Collector monitors all Windows event logs. When an event matching a specified filter is determined it is transferred to the ELM Server and then stored in the database.
ELM will run queries against the database to populate Event Views and trigger notifications as well as generate reports.
Unlike some event log products, ELM provides the ability to collect ALL events by default, and filter them down accordingly for your specific needs.
 Event File Collector
Securely moves and clears native .evtx files off host machines.
Event File Collectors do just that – collect raw .evtx logs on Windows desktop and server operating systems. You can specify which logs to collect, and optionally clear the Event Logs at each collection interval. Collected .evtx files can be compressed and signed if a signing certificate is available.
The Event File Collector operates at a scheduled interval you determine. At each interval, the Event File Collector will attempt to talk with the Log service, select the appropriate log files and then copy the specified Event Log Files from the assigned Agents to a defined storage location.
The files are stored by default on the ELM Server in a sub folder.
 File Monitor
Scans log files and directories for specified character string matches.
The File Monitor scans ASCII or plain text files or groups for files on a scheduled basis for a specific character string.
When a match is found, an action can be triggered such as writing an event to the database that a can start a correlation sequence or launch an alert.
Commonly monitored files include:
- Custom Application Logs (non circular)
- IIS log files
- SQL Server error logs
- Backup software log files
- Anti-virus software log files
 Event Monitor
Determines if specified events have NOT been written within a given time period.
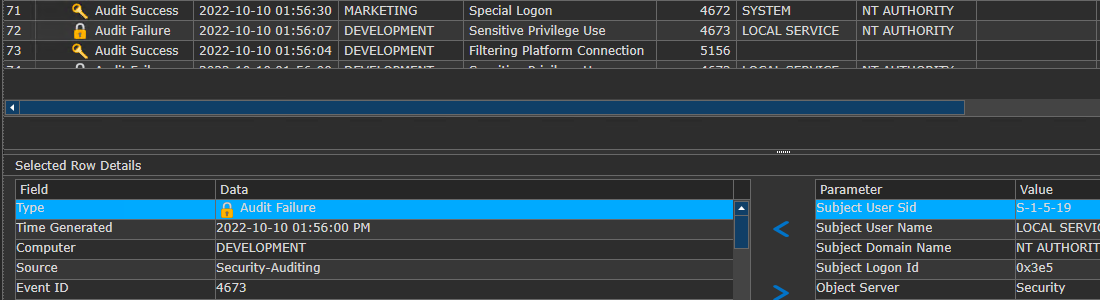
The Event Monitor compares new events against a set of Include and Exclude Filters. If an event matches or fails to match these criteria within the specified interval, a local Action is executed under the local administrator account.
Actions include writing an event to the database when an event is found, or not found, so that the occurrence can be queried against for a view or to trigger a notification.
A command script can also be launched to perform a corrective action.
 Syslog Receiver
Receives Syslog Messages from Linux/UNIX systems and network devices.
The Syslog Receiver is configured to process and parse Syslog messages from network devices and Linux/UNIX systems. Supporting both UDP and TCP, these messages are converted to the standard Windows event log format. Parsing allows mapping of fields from within Syslog Messages to Event fields for custom viewing.
Like Windows events, they are stored in the database and queried against to create concise views and trigger alerts or notifications.
The Syslog Receiver is a valuable tool for supporting firewalls and the security of Windows networks.
 SNMP Receiver
Receives SNMP v1, v2 and v3 Traps and converts them into a Windows event format.
The SNMP Receiver is configured to accept SNMP v1, v2, and v3 Traps from network devices. These traps can be translated against stored .MIBS and converted into a standard Windows event log format.
Like Windows events, they are stored in the database and queried against to create views and to trigger alerts or notifications.
The SNMP Receiver allows for real-time monitoring, alerting and reporting of Windows and non-Windows systems together on a single platform.
 SNMP Monitor
Queries SNMP Object IDs and compares result to expected values.
The SNMP Monitor includes a MIB browser that queries a SNMP Object ID (OID) and triggers an Action if the value is greater than, less than, or equal to a specified value for warnings, success, or failure.
Events generated can be written to the ELM database or to an Application log.
It extends the status monitoring of ELM beyond Windows systems and into SNMP supported network devices.
 SNMP Collector
Collects and stores SNMP Object IDs for trend analysis.
The SNMP Collector monitors the SNMP Object IDs by polling devices on a scheduled basis, much like a performance collector, and returns the values to the ELM Server.
It will display the OID, Translated Name, and the Community fields.
These values are stored in the database for reporting and trending analysis.
 Inventory Collector
Detects changes in OS versions, new and existing applications, and installed hardware.
The Inventory Collector gathers data about what is installed on each Windows-based system. You can collect data on the Windows operating systems, installed services, and applications that have been installed and added to the Apps and Features applet in Windows Settings (Windows Control Panel).
The Inventory Collector also allows you the flexibility to add specific services to the Inventory or exclude certain products. By default all products are included in the inventory.
Performance and Status Monitoring Features
 Ping Monitor
Pings systems at scheduled intervals and monitors for 9 different status changes.
The Ping Monitor sends custom ICMP echo requests to verify TCP/IP connectivity and Quality of Service.
It provides an early warning alert of a problem with a remote system’s status.
You may specify the size of the echo request packets and the number of packets that are sent. The Ping Monitor will execute the configured Actions (when enabled), depending on the results of the Ping.
- The Success Action will be executed if all echo requests succeed.
- The Warning Action will be executed if at least one echo request fails and at least one succeeds.
- The Failed Action will be executed if all echo requests fail.
Even though the Ping Monitor is assigned to Agents, it is always executed by the ELM Server and can be run at a pre-defined schedule that you determine.
 Performance Monitor
Tests performance objects/counter/instances against target results using >,=, or < operators.
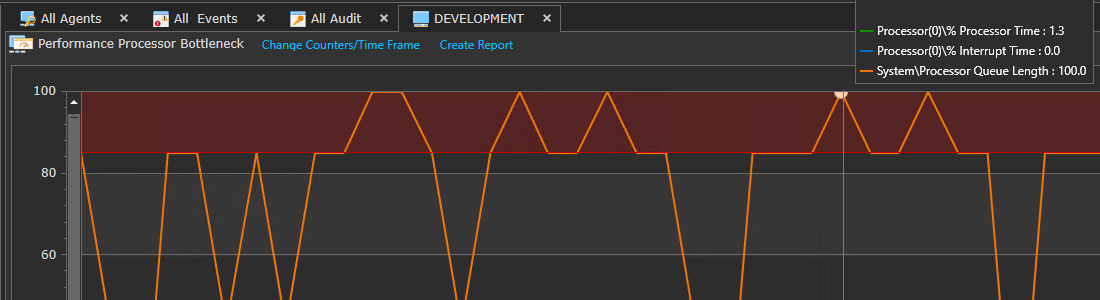
Performance Monitors can be used to monitor any published performance counter for a condition that is greater than, less than or equal to a threshold value you determine for the specified duration that is appropriate for your server’s function.
By using Performance Alarms, you can be alerted when disk space, memory or CPU has reached unexpected or out-of-bound levels.
 Performance Collector
Scheduled collection of any Windows published performance counter/object/instance.
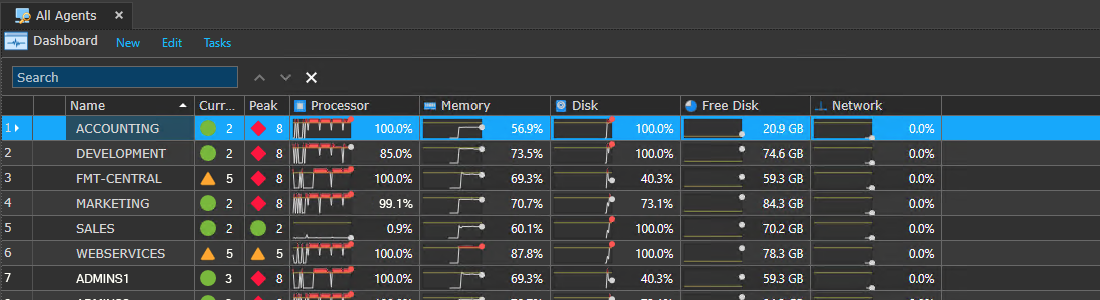
The Performance Collector supports proactive system management and resource monitoring by passing collected data to the Dashboard and comparing against pre-determined thresholds for bottleneck status displays. Any published performance objects, counters and/or instances can be collected at a set frequency on a scheduled basis.
- Disk Performance
- Free Disk Space
- Memory Usage
- Network Performance
- Processor Performance
 Process Monitor
Detects new processes, failed processes and monitors CPU thresholds.
The Process Monitor provides a comprehensive view of a system’s process activity. The Process Monitor is multi-functional; it can notify you when a process has exceeded the threshold of CPU usage you specify and it can track when processes are started or terminated.
It can also generate a Warning or Error when the number of instances of a process exceeds your specified value.
 Service Monitor
Monitors for changes in service states from Running, Paused, and Stopped.
The Service Monitor detects and responds to changes to the service status. It monitors changes into the conditions:
- Starting
- Started
- PausedStopping
- Stopped
It is commonly used with the Command Script notification to restart a failed service. Alerts can be triggers that confirm a service has stopped and was successfully restarted. This empowers administrators to combine monitoring with automated corrective actions.
 Script Monitor
A distributed ‘Task Scheduler’ able to run virtually any PowerShell, VB or CScript on a remote system.
The Script Monitor, first introduced in ELM Enterprise Manager 7.5, allows the ELM Agent to run virtually any PowerShell, VB, or CScript on a remote system on any schedule that is configured.
It operates like a distributed task scheduler providing administrators with great control and precision for automating jobs.
 WMI Monitor
Queries the Windows Management Instrumentation namespaces for results change.
If you are using Windows Management Instrumentation (WMI) — the Microsoft implementation of Web-Based Enterprise Management (WBEM) — you can use WMI Monitors to query a WMI namespace and database.
The WMI Monitor queries the WMI namespace (typically rootcimv2) and generates Events when the results of the query change that you can be notified on. Common applications include detection of new external drives and file changes.
It’s a powerful tool for expanding the data sources available to identify system changes or activities.
Application and Network Monitoring Features
 Web Page Monitor
Monitors SSL Certificate for expiration and 9 different status changes.
Web Page Monitors are used to monitor HTTP or HTTPS URLs. The ELM Server periodically establishes an HTTP connection to the server and port specified. If the response is negative, slower than expected, or if the content has been changed, a variety of notification options can be triggered.
Note that multiple Web Page Monitors can be assigned to the ELM Server or to Service Agents. This means you can create Web Page Monitors independent of the number of Agent licenses you have purchased.
 FTP Monitor
Executes a connection to a FTP site and evaluates availability and quality of service.
The FTP Monitor item monitors the status and availability of an FTP site – any valid and accessible FTP server on your network.
An application-layer FTP connection to the FTP Server is made at your specified interval and anonymous or authenticated connections are supported. By default, port 21 is used, but the monitor can be configured to use any port.
Because the ELM Server (not an Agent) makes the FTP connection, you can monitor FTP server availability and Quality of Service (QOS) on any operating system running FTP server software such as Unix, Linux, Novell, Solaris, etc.
Fault Tolerance Features
 Event Writer
Schedules a “Heartbeat Event” for Point-to-Point Verification.
The Event Writer is designed to ensure events are being collected and the monitored system is sending events to the ELM Server. This type of point-to-point verification goes beyond a simple Ping and ensures that the system is actually reporting as expected.
At the Agent level, the Event Writer publishes a pre-configured event on a schedule into the local Application Event Log. ELM can be configured to look for this event, ensuring events are being collected and the system is functioning correctly. This fault tolerance feature tests the entire loop from event generation, to collection to filtering and notification.